Facebook Insights gives tons of metrics needed to monitor your campaign performance and optimize the marketing on the platform further.
But sometimes, for new businesses and startups, it is hard to get their head wrapped around the plethora of Facebook metrics available and pick out the key indicators needed to better evaluate their performance.
As if it was not enough,
Facebook recently added more to the confusion by completely overhauling the look and feel of its analytics section.
Don’t worry. This blog will cover every key Facebook metric that you should track and why it is crucial for your overall Facebook marketing strategy.
Let’s roll!
Why Is It Important to Analyze Your Facebook Metrics?
According to statistics, 1.6 billion people connected with a small business on Facebook, which is enough evidence of the platform’s affinity for SMBs and startups.
Now, calling shots on the platform without assessing Facebook insights could be a total waste of such a powerful marketing channel.
That’s why!
When using Facebook to market your business, it is crucial to have a data-driven strategy derived from the key metrics that align with your marketing goals.
Agreed yet?
If not, then let’s see the list of consequences of avoiding Facebook metrics:
- Wrong audience targeting
- Fewer impressions and reach on posts
- Fewer conversions through better ads
- Low returns on Facebook marketing expenditure
- Less engagement
- Missing on the best times to post on Facebook
- Less referral traffic
And the list could go on.
Thereby, it is important that you make a proper analysis of all your key productive metrics to avoid the listed setbacks.
So, without further ado, let’s dive into the key metrics you need to track to grow your business on Facebook.
11 Facebook Metrics Your Business Needs to Track
Did you know there are two ways to access your Facebook metrics inside the platform?
- The normal Facebook insights
- The Facebook Meta Business Insights
Although, the normal insights give you a surface-level view of metrics on Facebook. So, we are going to consider Facebook Meta Business Suite and one more analytics to take your reporting to the next level.
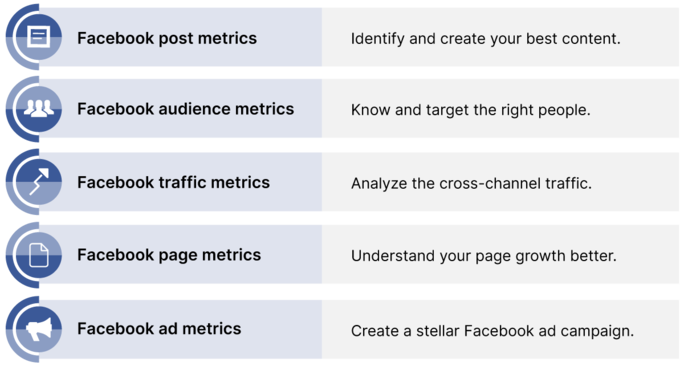
For your convenience, we have divided all the significant Facebook metrics into the following categories:
Here comes the first one.
Facebook Post Metrics
Facebook post metrics are the most crucial indicator to tell you about your content’s reach and how well it resonates with your audience.
1. Engagement
Engagement tracks the number of actions people make on your posted content. It can be in the form of comments, click-throughs, likes, and shares.
Where Can You Track It?
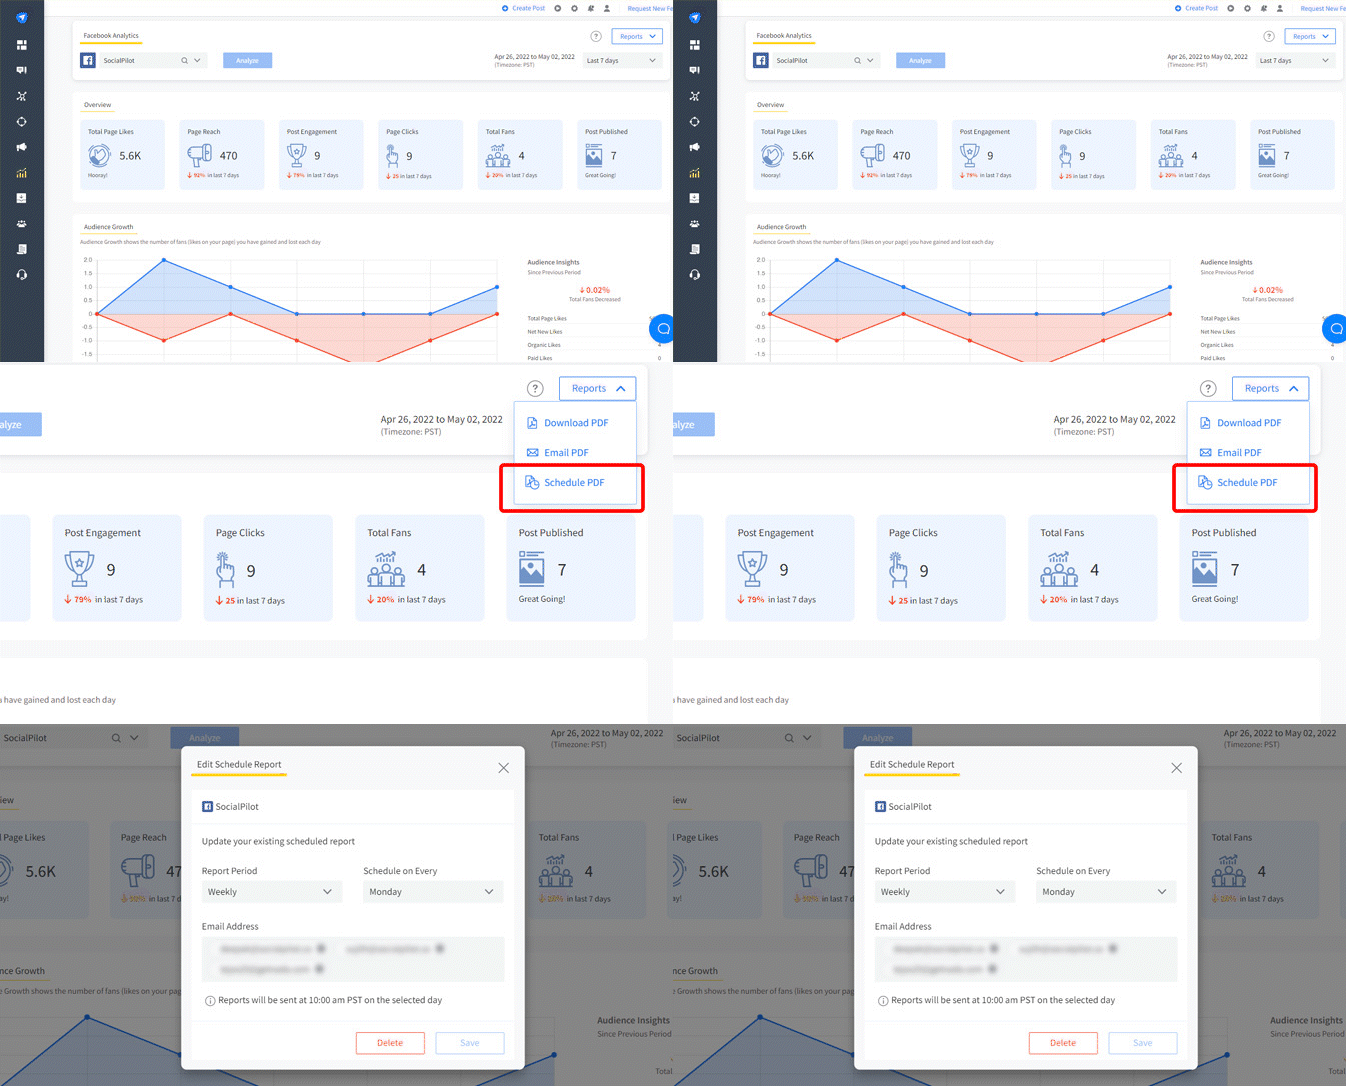
You can easily track the engagement metrics on your Facebook Meta Suite’s Insights page under the “Content Overview” section.
The engagement section breakdown the insights into different parts, starting from the overall engagement to the median calculation of engagement on every post type.

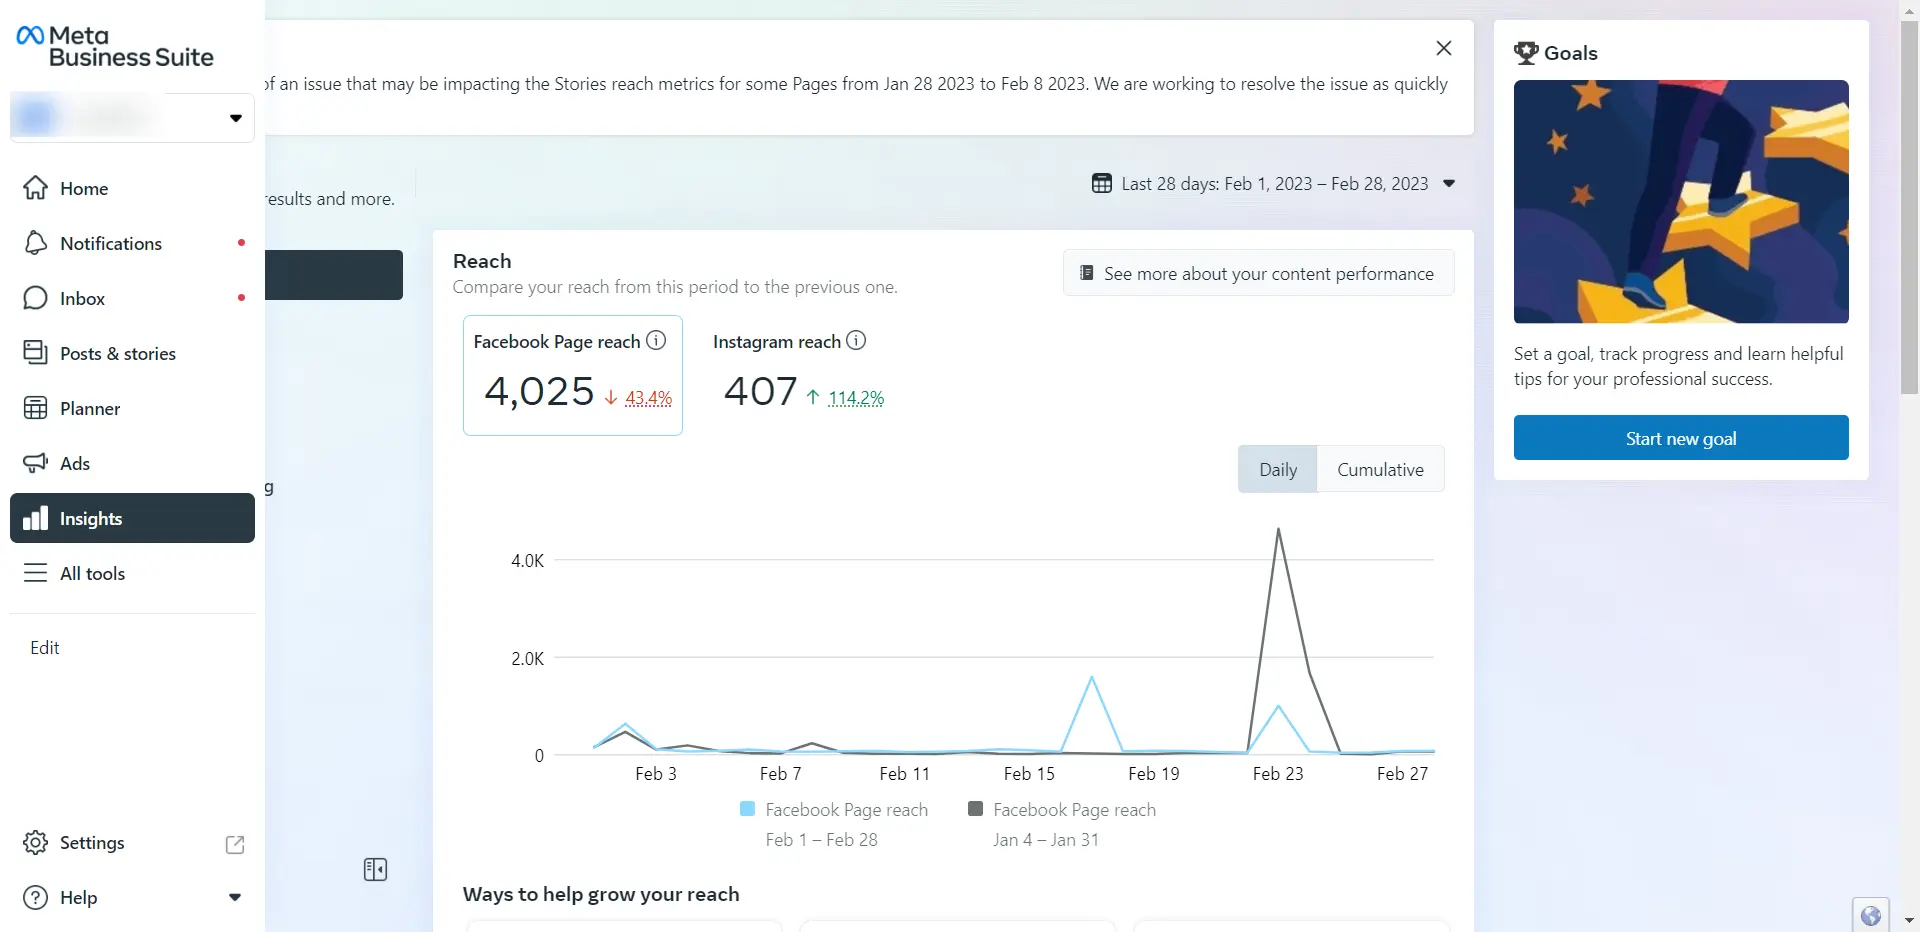
Another efficient way of accessing your engagement metrics is with SocialPilot’s Facebook analytics feature.

A tool like SocialPilot becomes a necessity rather than a mere option if you are someone managing multiple Facebook accounts.
It allows you to track the analytics of multiple Facebook accounts under one dashboard.
In addition to that, you can also monitor and export analytics of numerous social media platforms, such as Twitter, LinkedIn, Instagram, and Pinterest.
Yes, you heard that right! The exports feature lets you download or share the social analytics report directly from the tool with multiple email ids.
Do you dread the task of sharing social performance reports with clients periodically?
Don’t worry, and leverage the “Schedule Report” feature of SocialPilot analytics to automate the sharing of your reports on a specific day of the week or the first of every month with clients. Say goodbye to the turmoil of generating social media reports manually every month.
Why Is the Engagement Metric an Important Facebook KPI?
The engagement metric is the most crucial factor in indicating your content’s worth on social media.
More people engaging with your posts is evidence that your content is resonating with your users. So using this metric, you can figure out which form of content is working for you and which isn’t.
But that’s not all.
Good engagement also gives you an advantage in the eyes of the Facebook algorithm. Once the algorithm detects that users find your content interesting, it will show more of your content in their feed.
2. Reach
Reach tells you the number of people who have seen your content on Facebook. It is quite a vague number compared to engagement, but it still keeps you informed about your potential audience size.
Where Can You Track It?
Like engagement, you can see the overall reach of your posts, along with the median post reach per media type and content format, under the “Content Overview” section.
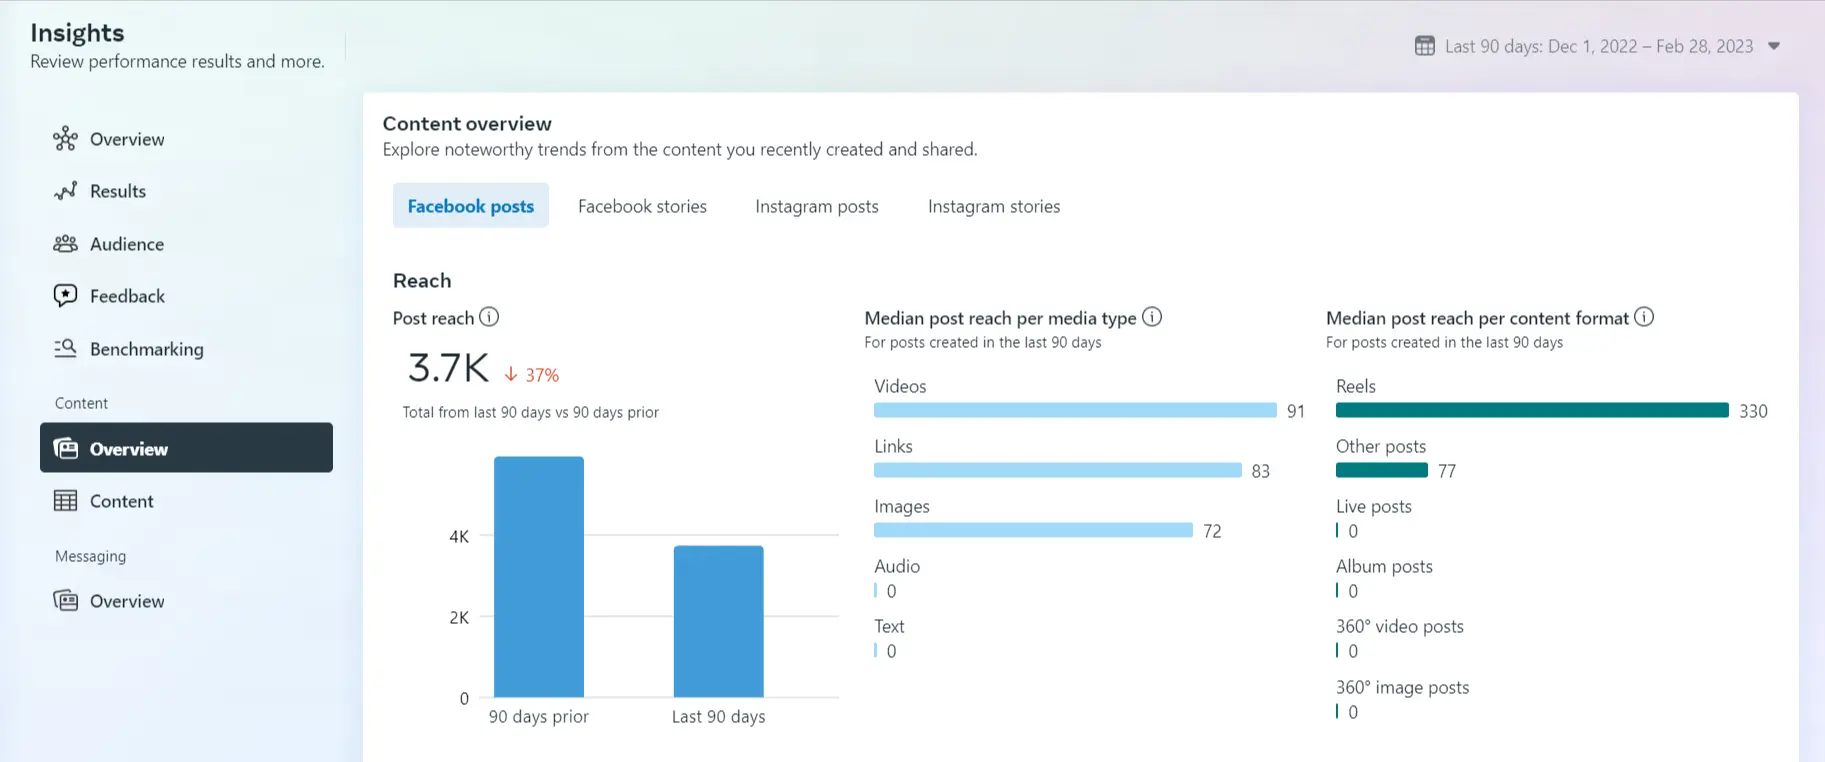
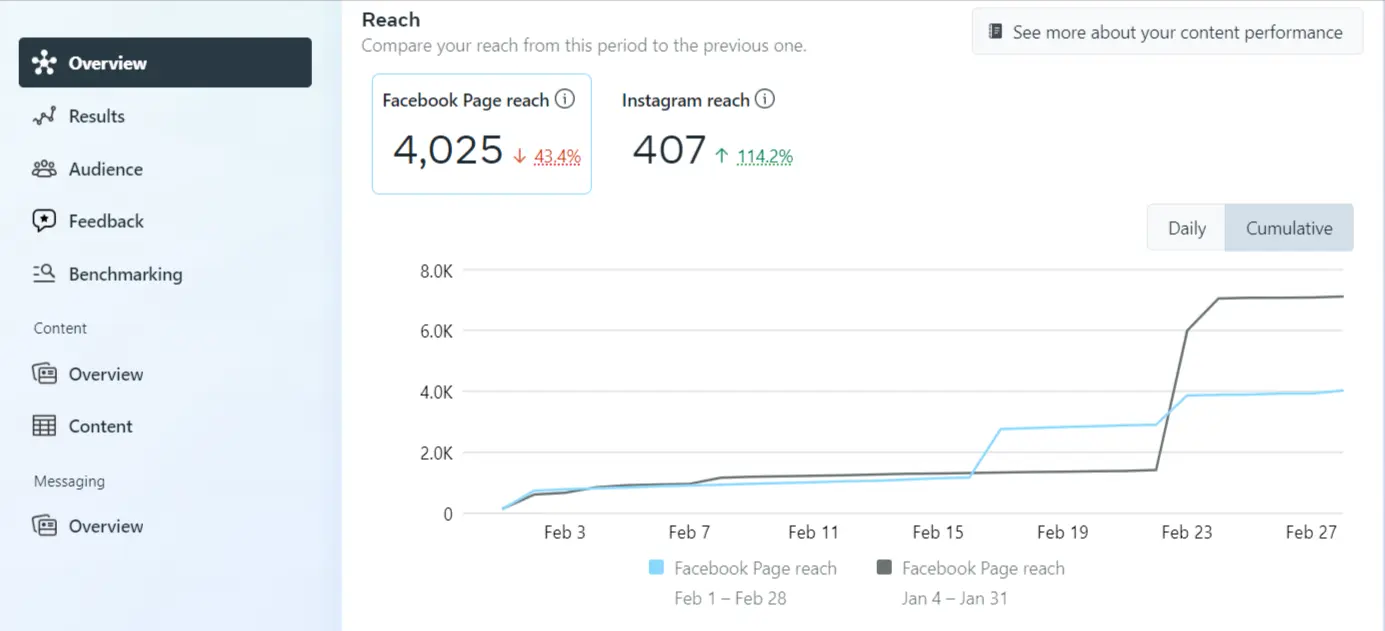
Also, to compare your post’s reach over time, you get a graphical representation of your overall reach in the “Overview” section of the Facebook Insights page. What’s more? You get a reach comparison between the selected time frame and the previous time frame.
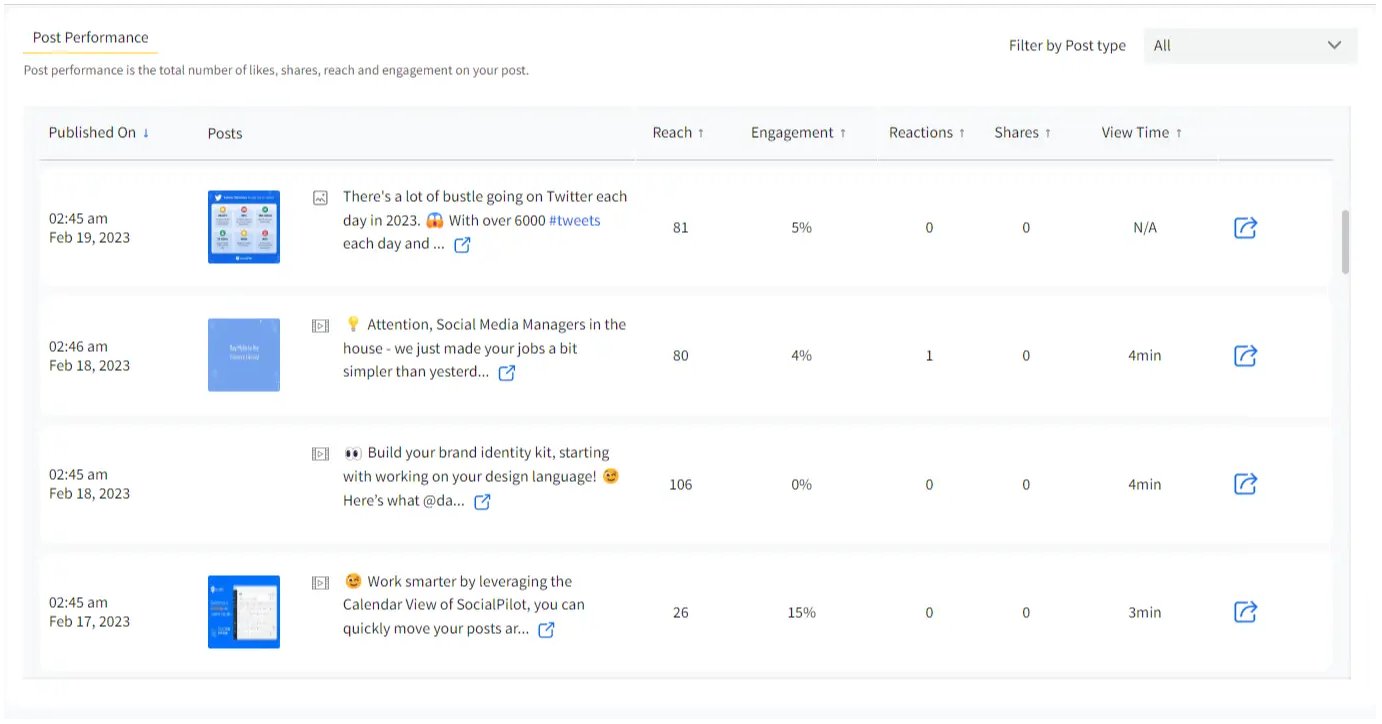
SocialPilot also gives you a clear look at the reach of every post.
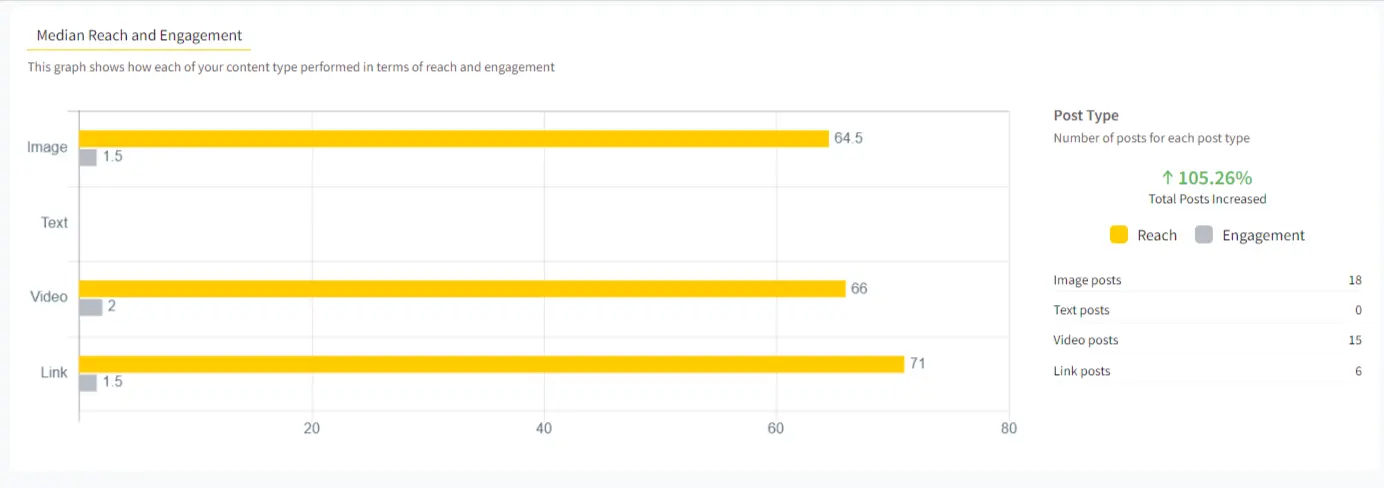
If you are fond of the new median metric calculation of Facebook and want to look at the median reach of each content type, there is a graph for that inside SocialPilot.
Why Is the Reach Metric an Important Facebook KPI??
If your business has just seen the social media world’s light, then ‘reach’ can be the most vital metric to assess your brand awareness.
But here’s a piece of bad news.
Organic reach on Facebook has been at all-time low since 2012, so if you are looking to increase your reach drastically on the platform, you need to resort to Facebook ads for the needed boost.
Still, there is a bright side!
By analyzing your reach metrics, you will see which post of your account is getting more organic reach, so you can further boost it to tenfold the number.
Another reason to analyze and strive for good reach is that it directly affects your engagement metrics. The more reach a post has, the better it’s chances of getting good engagement.
3. Impressions
Reach and impression are somewhat the same with a subtle distinction.
What is it?
Reach gets counts for every unique person seeing your posts.
Whereas, impressions count the number of times someone has seen your posts, no matter if it’s the same person watching it again and again.
For example, if someone sees your post on the feed and again encounters it as a shared post from someone, it will be counted as 2 impressions but 1 reach.
How to Track Impressions?
If the impression is a metric that you deem crucial to check your Facebook performance, then there is sad news for you – Facebook doesn’t show it anymore.
But don’t worry because SocialPilot has you back here.
You will find the impressions garnered over a period of time by your paid and organic posts. The total impressions are represented under the Viral tag.
Plus, it will show how well your posts have performed in terms of impressions as compared to the previous period.

Why Is the Impression Metric an Important Facebook KPI?
The impression metric is an excellent way to find out the virality of a post. But keep in mind that not every post with an impression is a viral post.
Your impression count will always be equal to or higher than your reach. But to define that a post is viral among your users, you need to have a larger number at the side of your impression.
Did you know that impression can also lead to conversion?
According to the “marketing rule of seven,” your prospects have to come across your post an average of 7 times before taking any action.
Thereby, having more impressions on your posts can lead to more conversions. So keep track of the posts that have substantial impressions and try to make more of such content in your Facebook ad campaigns.
4. When Your Fans Are Online
This section tells you about the presence of your audience on Facebook across the week. Its graphical representation shows you, on average, how many of your fans are online on a day or week at a specific time.
Where Can You Track It?
Unfortunately, Facebook has also retired the “when your fans are online” graph.
Fret not; we still have it!
SocialPilot tells you about the number of fans active on Facebook at each hour of the day.

Why Is the “When Your Fans Are Online” Metric an Important Facebook KPI?
With organic reach on a steep decline since 2012, using the best time to post on Facebook is the only way to cut through the noise and get some eyes on your content without using paid-ads.
But here’s the catch, every business has a different best time.
Enters the “When your fans are online” section!
This section briefly tells you the time when most of your fans are online to connect with your Facebook post.
What does this mean for you?
It means you can publish your posts on days and hours, showing the most fans online to get more reach and engagement.
Productivity Tip: You can schedule your posts for all your best times way ahead using social media scheduling tools.
Facebook Audience Metrics
Facebook audience metrics give you an in-depth insight into the age, gender, location, and language of your followers, fans, and the people that you have reached.
5. Age and Gender Demographics
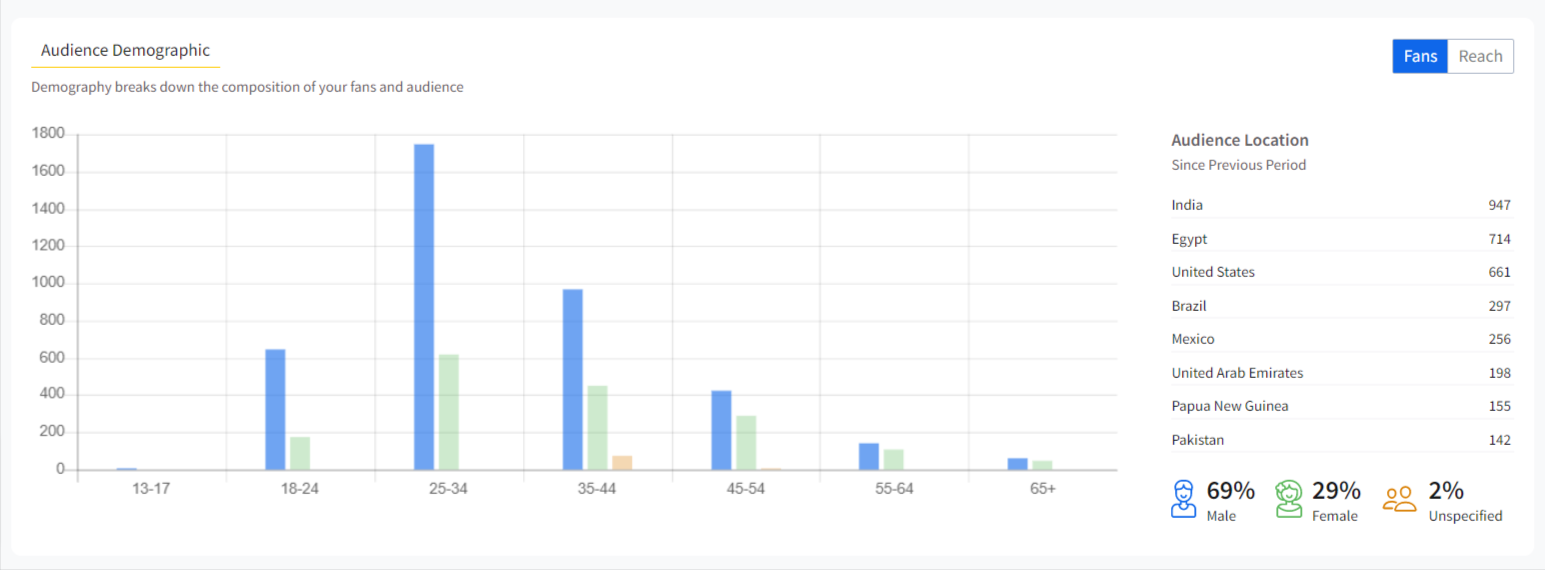
The age and gender demographics metrics are a great way to zero down on your relevant audience. This section gives a graphical representation of your fans and followers grouped by age and gender.
Where to Track It?
You can easily track the age and gender metrics on your Facebook Insights under the “Audience” section.
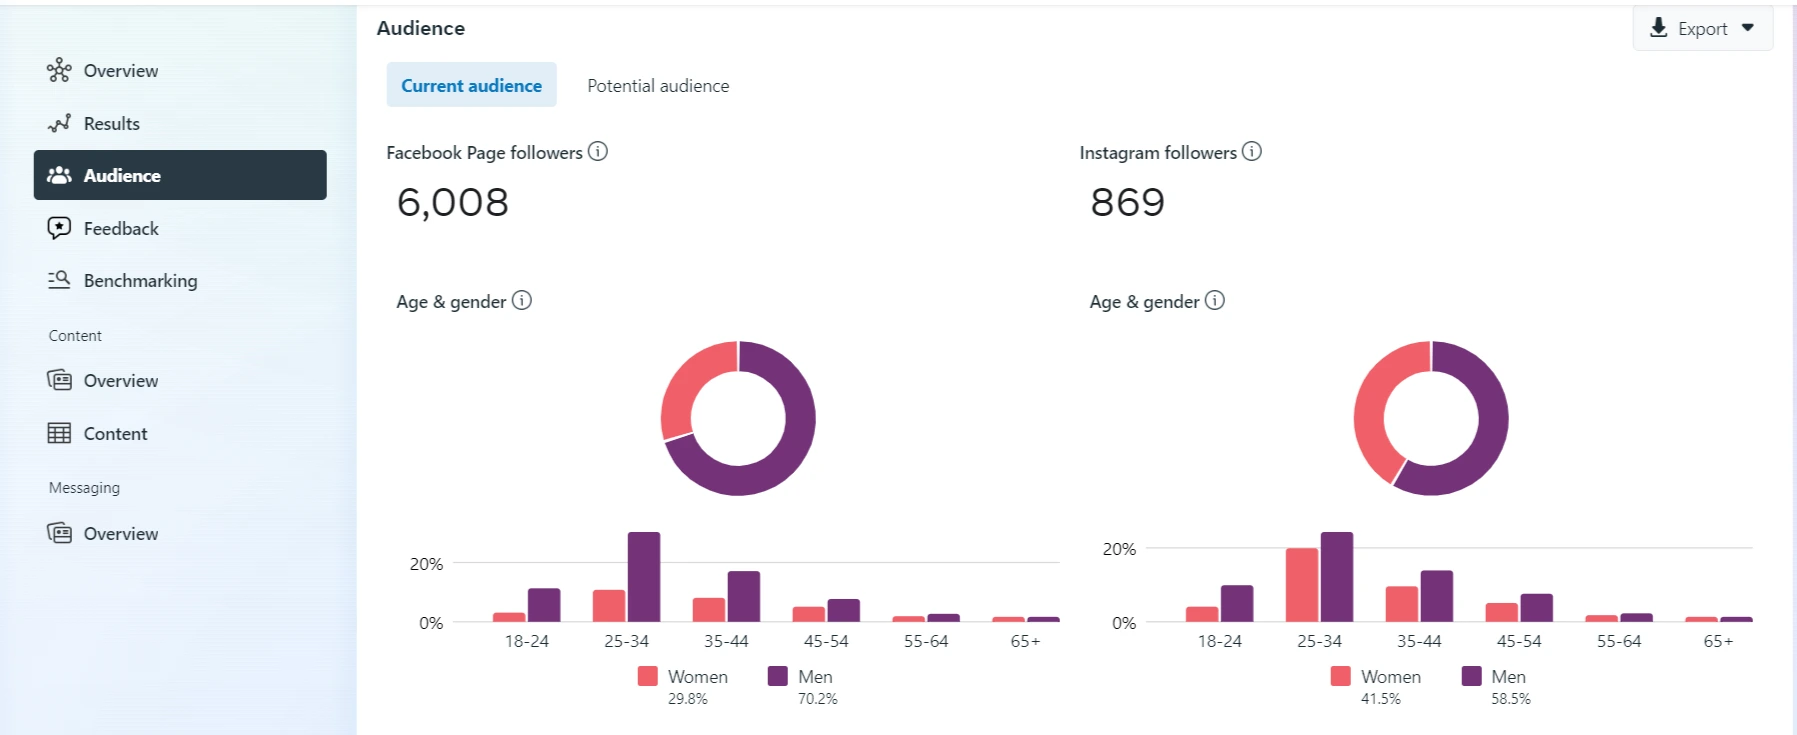
Alternatively, you can also check your audience demographics on SocialPilot’s Facebook analytic page.
Why Is Age and Gender Metrics an Important Facebook KPI?
Imagine a business that sells canes for older people creating a Facebook post using Gen-Z lingo. Surely, it would not go down with good engagement.
That is why you need a better understanding of your target audience to create a solid Facebook content strategy.
Simply put, looking at your follower’s breakdown based on age and gender helps you set a more holistic content marketing strategy.
So dive down into your age and gender metrics to find out your relevant audience and create content that caters to that lot.
6. Location and Language Metrics
As an elongation of age and gender metrics, this section helps you get insights into the location and language of your fans and followers.
Where to Track it?
You will get this data in a tabular form right below the age and gender metrics. Previously, Facebook used to show the data of the different languages that your fans speak. Since it is discontinued, you need to figure out that part based on the country and city data.
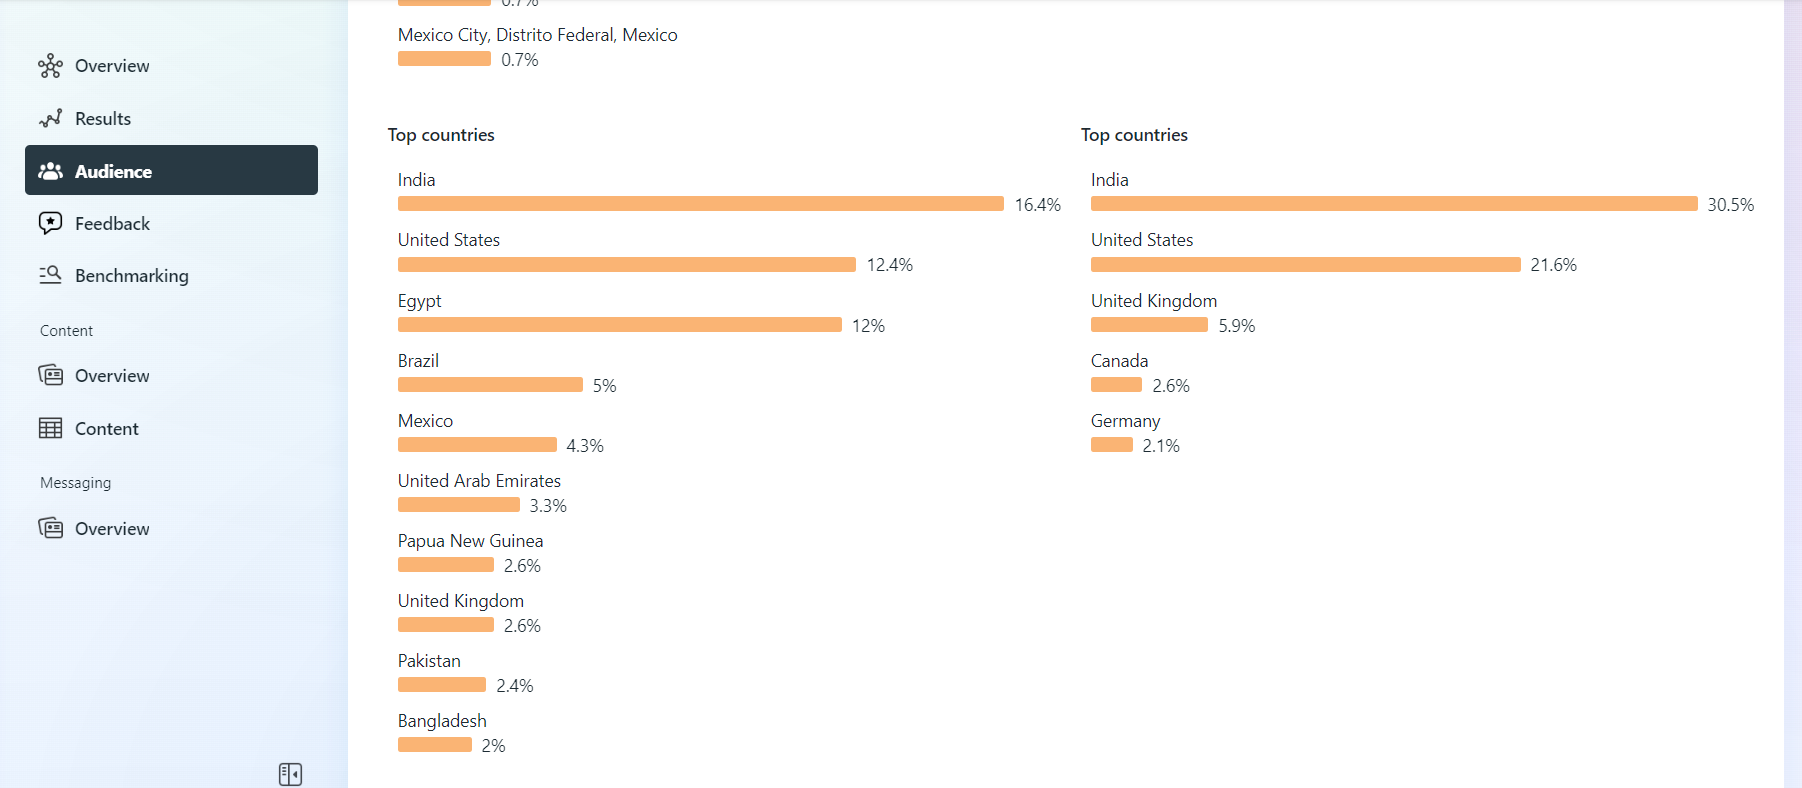
SocialPilot also shows you the same data alongside the age and gender graph, which we have already added in the above section.
Why Should You Track the “Location and Language” Metric?
If you are a brand catering to locations worldwide, then it is for sure that your one-size-fits-all content approach won’t work for everyone.
What’s the solution?
It would be best to opt for a content localization strategy that suits your target audience’s linguistic nuances, cultural and social factors, aesthetic choices, and even political and religious norms.
Luckily you can get a clear idea of your Facebook audience’s location and language preferences using the audience insights and mold your content accordingly.
Productivity Tip:
Use the Facebook audience targeting feature to show your post in the news feed of a specific segment of people based on their location and language.
Facebook Traffic Metrics
This category tells you the amount of traffic being driven to your website and Facebook page.
7. Facebook Referral Traffic
Facebook referral traffic metrics tell you about the amount of traffic coming to your website from your Facebook page. This traffic can be coming from visitors clicking on your profile, posts, and shared posts.
Where Can You Track It?
Google Analytics shows you all the data around your referral traffic. Make sure that you already have a Google Analytics account set up.
To access this data, click on “Acquisition” from the left-hand menu in Google Analytics, and then go to Social>Network Referrals. Here you will see the traffic your website is getting from all your social media networks. Find Facebook in it.

Why Is It Important to Track Facebook Referral Traffic Metrics?
For every business, it’s essential to evaluate whether their content on Facebook is pulling enough people back to their website or not.
Facebook referral metric helps you keep track of Facebook-to-website visitors. It gives you a holistic look into the number of sessions on your website, how many pages were viewed, and how long the user stayed on your site.
Overall it tells you how compelling your content or headlines were that people clicked on them and cruised inside your site.
So, if you see the referral traffic declining, it means that people are not finding your content effective enough to click.
Productivity Tip:
Productivity tip: Use a killer social media call to action that prompts users to take action on your Facebook posts.
Facebook Page Metrics
Facebook page metrics informs about the number of likes and follows on your page.
8. Page Likes and Follows
As the names suggest, page likes are the number of people who liked your page to support and followe it to see your content on their feed.
But there’s a thin distinction between page likes and follows.
When someone likes your page, it gets followed automatically. However, they can opt to unfollow it, so they don’t receive any further updates from your page. Still, these people will be shown as your audience.
On the other hand,.
If they unlike your page yet still follow it, they will be counted as your lookalike audience but not as your audience.
Where to Track Them?
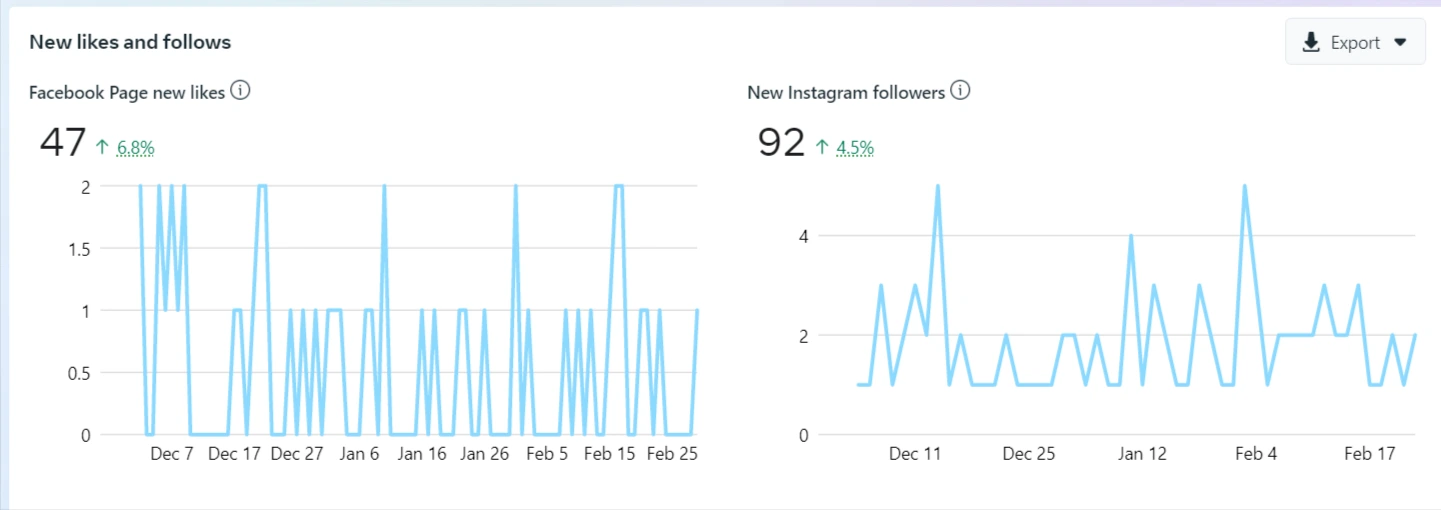
To track the in-depth insights around your page likes, go to the “Results” section under Insights.
Here you will see the breakdown of the likes you have got over the time of your chosen period.
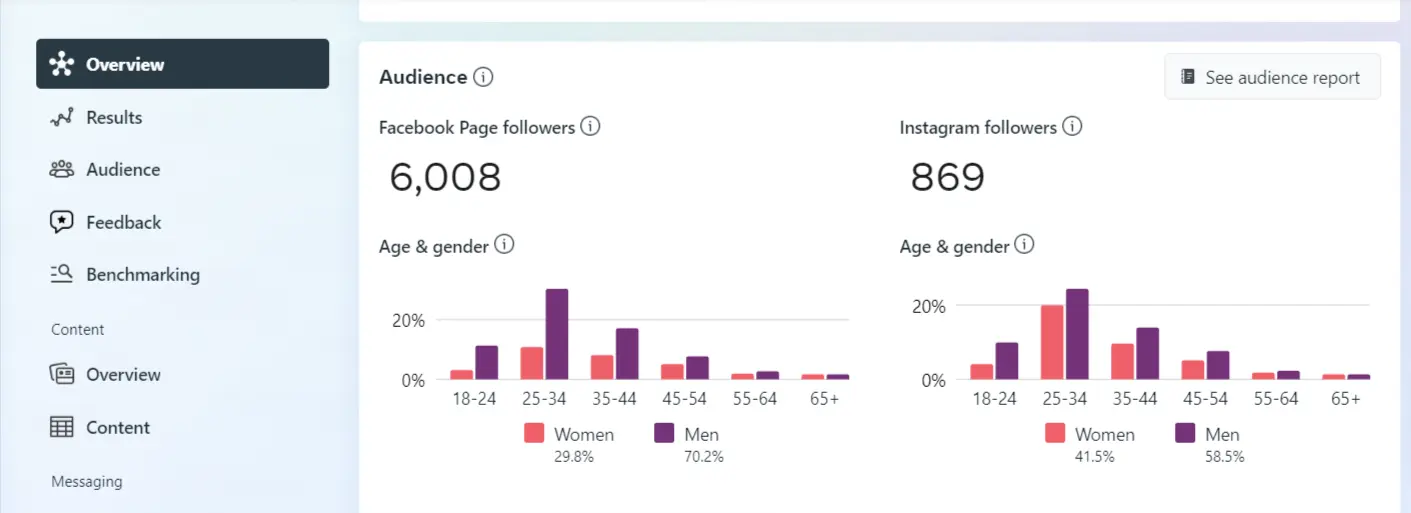
And if you are looking to track your page followerss,
Go to the “Overview” section to get the breakdown of your followers during the time of your chosen period.
SocialPilot also tells you the number of page likes you have lost and gained each day to paint a proper picture of audience growth.

Why should you measure the page likes and follows metric?
It’s true that page likes and follows are a vanity metric when compared to the engagement metric.
But still, as a new business page, it gives you a fair idea of your audience reach and your growth rate on Facebook.
Anyways, increasing followers is a far better sign for your business than stagnant follower numbers. If you see your follower’s growth declining or not growing month by month, there is something off with your Facebook marketing.
Facebook Ad Metrics
Facebook Ads manager gives you tons of metrics to monitor your ad campaign. But the sheer amount of data can be overwhelming for anyone.
So the trick to get the most out of your Facebook ad metrics is to keep your marketing goal in sight while evaluating them.
Here, we have touched briefly on some of the most common ad metrics that every business needs to track.
Where Can You Track It?
You will get every metric related to your ad performance inside the Facebook ads manager.
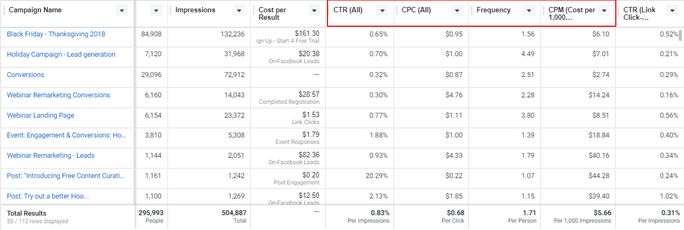
Let’s see some of the most common metrics that can be of high value to you, depending on your campaign goals.
9. CTR
Click-through rate (CTR) metrics show you the percentage of people coming toon your landing page after clicking through your ad.
Why Is the CTR an Important Facebook Metric?
CTR is one of the most crucial metrics to evaluate your ad campaign’s effectiveness. It gives you an overall view of your ad’s performance in attracting users.
A good CTR tells you that your ad is of quality and has an excellent relevant score too. So if your CTR is hitting rock bottom, then make some changes in your ad copy and try to make it more relevant for your targeted users.
10. CPC & CPM
So on what basis do your Facebook ads get charged?
Facebook ads manager gives you multiple options to be charged, and two of them are cost-per-click (CPC) and cost-per-thousand-impressions (CPM).
CPC metrics tell you how much you are paying when someone clicks on your ad, and CPM shows how much you are paying for every thousand impressions on your ad.
Why Should You Track These Metrics?
Both CPC and CPM align with your objective to create better reach and brand awareness on Facebook.
Instead of monitoring your whole budget, it will be more informative if you peek at these two metrics to evaluate the worth of your spending.
11. Ad Frequency
Ad frequency refers to the average number of times your targeted audience sees a specific ad on their Facebook feed.
For example, your ad frequency will be 4, if your ad is seen by the average targeted audience 4 times.
Why Should You Track This Metric? Why should you track this metric?
You might be thinking, the more the frequency, the better.
Well, no. According to ad espresso’s report, as the ad frequency increases, it decreases the CTR and gives a hike to your average CPC.
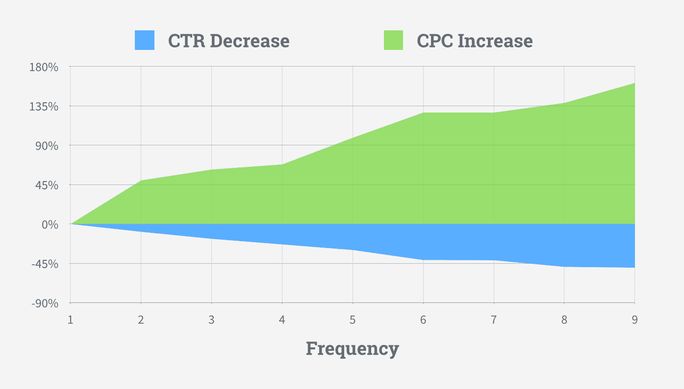
But then again, I have told you about the rule of seven, where a person must come across your ad seven times to be interested in making a decision.
See, the escape from this dilemma is to create the same ad but with multiple variations. Tweak the visuals and copy of your ad so that it doesn’t become boring for your audience and lose its impact over time.
Okay, we are done with all the Facebook metrics that could help assess your performance to make better Facebook marketing decisions.
Let’s quickly summarize them.
So, which metrics are you going to track?
Facebook provides a plethora of metrics to measure and maintain your account’s performance steadily. Choosing the metrics that matter the most to you totally depends on your marketing goal.
We hope this blog gives you a reference point to start evaluating your key Facebook metrics.
Also, don’t hesitate to use a fantastic analytics tool like SocialPilot to analyze multiple Facebook page metrics under one dashboard. It will save you a lot of time.
Happy assessing!
