If you’ve been following recent developments, you’re likely aware of the significant changes X (formerly Twitter) has undergone.
From the overhaul of Twitter Blue to policy shifts and leadership changes, including Elon Musk stepping down as CEO, these events have shaped the current landscape.
But what do the latest X (Twitter) statistics reveal?
Despite the turmoil, X remains a vital business platform, actively rebuilding trust with advertisers through new features like Twitter Blue and advertising incentives.
For instance, a social media report shows that 77% of X/Twitter users feel positive about community-focused brands.
To succeed on X (Twitter) in 2024, you need to understand its performance. We’ve gathered the latest X stats to help you refine your marketing strategies and maximize your reach.
X (Twitter) Demographic Statistics
Recovering from the turbulence, as of April 2024, X (Twitter) has gained over 250 million daily active users and more than 550 million monthly active users (MAUs).
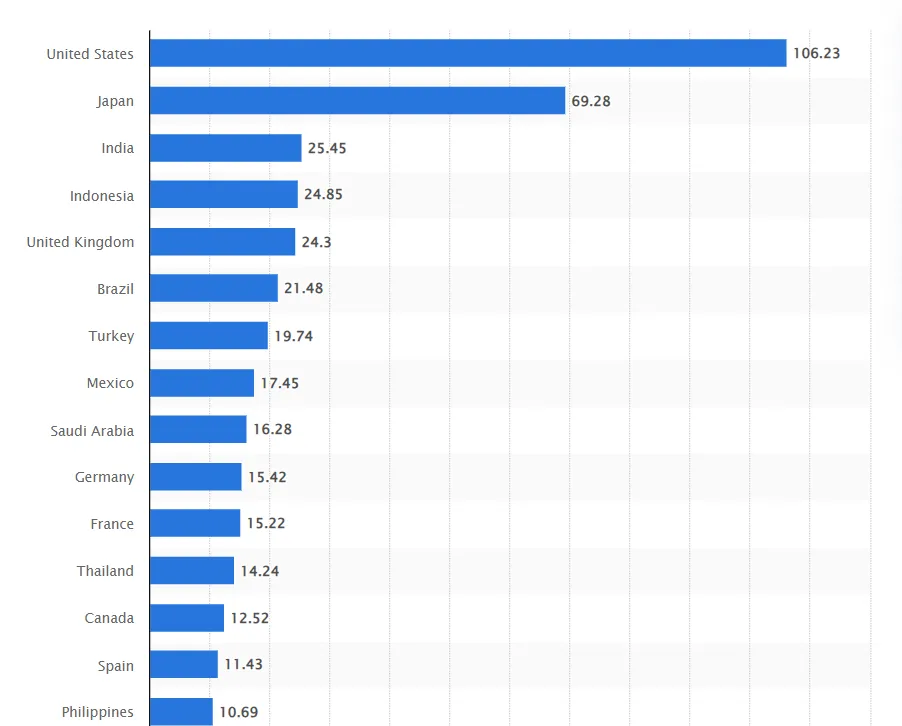
As of April 2024, the U.S. had the highest number of X/Twitter users, with 106.23 million users, while Japan and India were ranked second and third, with 69.28 million and 25.45 million users, respectively. Check out more Twitter statistics on demographics here.
- X/Twitter has over 550 million monthly active users.
- The U.S. leads in terms of total X/Twitter users, with 106.23 million users, followed by Japan and India, with 69.28 million users and 25.45 million users, respectively.
- X/Twitter has a 60.9% male audience and a 39.1% female audience.
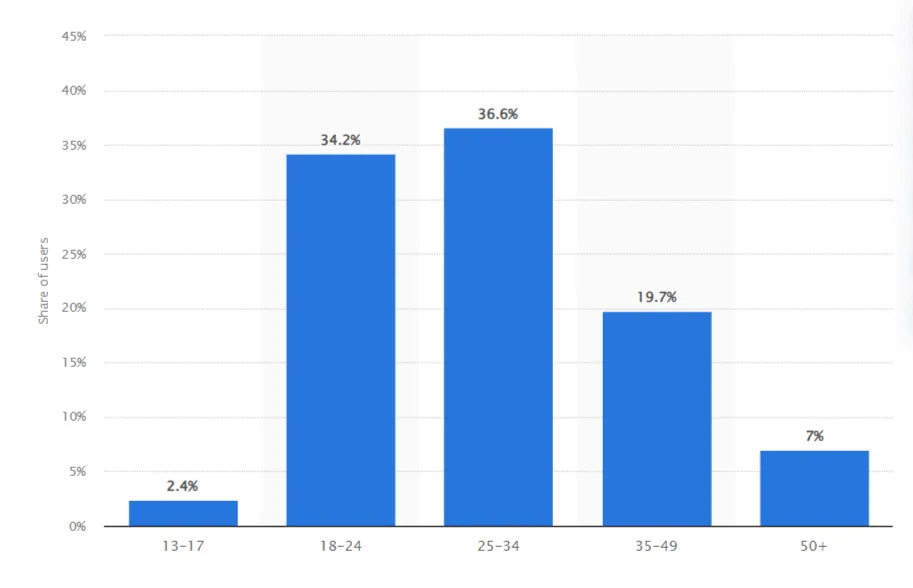
- Most of X/Twitter’s audience (36.6%) is between the 25 to 34 age group. The age group 18-24 makes up 34.2% of the total audience, followed by 35 to 49 years, who make up just 19.7% of the X/Twitter user base.
- As of April 2024, Twitter is the 13th most popular social media in the world in terms of users.
- The website Twitter.com received 112.9 billion visits in 2023.
- As of September 2023, 41% of the X/Twitter users from the UK are from high-income groups, 32% fall into medium income, and the remaining 27% fall into the low-income range.
- According to a survey, 40% of the X/Twitter users reported they would likely use the platform in a year, 35% of respondents said it is somewhat likely, and one quarter said it is highly unlikely to use it in a year.
- 29% of Americans who make over $100,000 a year use X/Twitter, 20% of users make between $70-$99k, 21% of users make $30-69k, and 18% of the users make less than $30,000 annually.
- Only 26% of American men use X/Twitter, while only 19% of females use the platform.
- 29% of Twitter users in the US have more than a college degree, while 24% have atleast a college degree, and 15% have gone to high school or less.
Sources: Data on X, Global X/Twitter audience, X/Twitter worldwide gender, Age groups, Total website visits, Household income UK, Statista, PewResearch,
X (Twitter) Usage Statistics
Twitter is one of the fast-paced networks, and activity never slows down. With an average user spending 30 minutes daily on the platform, it has become a key destination for adults keen on staying updated.
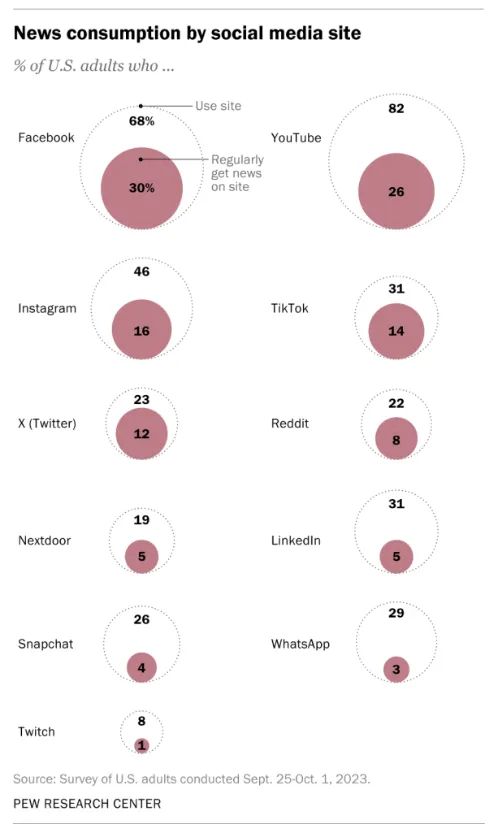
Interestingly, while only 14% of Americans get their news from X, a substantial 53% of its users flock to the site specifically for news. The constant stream of tweets on virtually every topic ensures that there’s always something new to discover and engage with, whether it’s breaking news, entertainment, or live events.
- On average, an X/Twitter user spends 30 minutes daily on the platform.
- Twitter has over 8 billion daily active user minutes in 2024, up 10% from last year.
- Four out of every five user sessions include watching videos on Twitter.
- Overall, video views on Twitter are growing at an average rate of 35% year over year, with the average time spent on video up +17%.
- In March 2024, people on Twitter spent 385 million hours watching videos! That’s about 1.4 trillion seconds, 23 billion minutes, or 16 million days worth of video.
- The most-followed Twitter accounts include figures such as Elon Musk (195.8 million), former U.S. president Barack Obama (131 million), and Cristiano Ronaldo (112 million).
- The Immersive Video player has over 100 million daily users – more than half of whom are Gen Z, the fastest-growing audience on X.
- The ‘😂’ emoji has been used the most, with over 3.7 billion uses.
- People posted over 13 million times on the day of the opening ceremony of the Paris Olympics, up by 25 from the Tokyo Olympics.
- Twitter users are spending 118% more time checking their DMS.
- Around 80% of X (Twitter) users who check their DMs also view conversations.
- Twitter received over 13.5 million video views on Selection Sunday, a +35% increase from last year.
- Each day, Vertical videos on Twitter get more than 100 million users.
Sources: PewResearch, Data on X, Daily user active minutes, Video views on X, Time spent watching videos, Wikipedia, Global Town Square, Exploding Topics, Time spent in DMs, X/Twitter post, Selection Sunday,
X (Twitter) Engagement Statistics
X/Twitter is great for creating engagement sprees in seconds. You just need to be insanely creative and good with words to get your message across. Unlike other platforms, Twitter is more of a wordplay.
Couple it with hashtags, and you are guaranteed better reach. Using just 1-2 hashtags can actually improve your engagement by 21%.
You can also put out GIFs and videos to add further context to your content. Look at some amazing Twitter statistics that can help you devise out-of-the-box strategies.
- News and entertainment are the most popular reasons for using X/Twitter, accounting for 48%.
- According to a 2023 report, 99.9% of the X users also use some other social media platforms.
- The average median posting frequency on X/Twitter is 3.31 per week.
- Media accounts post the highest number of Tweets per week, with a median of 50.2 posts.
- The median engagement rate on X/Twitter is just 0.029%.
- The sports teams on X get the highest engagement percentage, accounting for 0.072%, followed by higher education with 0.053% and non-profit organizations with 0.044%.
- The best posting time on X/Twitter is 8-10 am in the morning on weekdays.
- Verified Twitter accounts receive 3x more interactions than non-verified accounts.
- On average, the engagement rate for videos on Twitter is 0.17%.
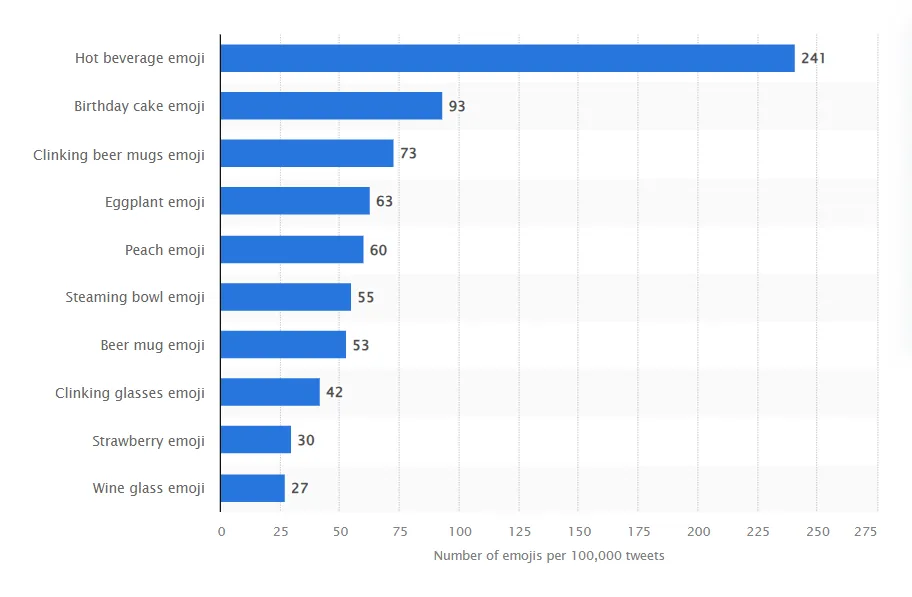
- As of March 2023, the hot beverage emoji was the most used food and drink emoji on X, being used 241 times out of every 100k tweets.
- In 2023, the top four conversation topics on X/Twitter were sports, gaming, music, and food.
- Twitter Communities saw a massive 495% growth in User Active Minutes year-on-year.
Sources: Exploding Topics, Data Reportal, RivalIQ, Social Media Benchmark Report, Emplifi, SocialInsider, Statista, X top conversations, Twitter Communities
X (Twitter) Business Statistics
Despite recent uncertainties, Twitter remains a key platform for business engagement. Users actively engage with brands, with 33% seeking answers to their questions and 16% using it for brand research. Additionally, 40% of users have made purchases based on what they saw on Twitter.
Businesses continue to use the platform for customer support and sales, showing its ongoing value in the business landscape.
Here are a few more stats that favor using X for business.
- 75% of X/Twitter users use the platform to engage with brands.
- 33% of X/Twitter users communicate with brands to get answers to questions.
- 20% of the X/Twitters users use the platform to complain about the brand.
- According to a study conducted on 1300 X/Twitter users, 29% of the respondents said businesses should respond to their messages within an hour.
- Tweet frequency decreased by about 15% from 3.9 posts in 2022 to 3.31 posts in 2023 across all industries as brands started pulling back their effort.
- Engagement rates on X/Twitter declined by almost 20% this year.
- Nearly 1.7 million users join X/Twitter every day.
Probably because everyone gets ban for nothing
Look up @VoltedMustang I’ll wait pic.twitter.com/DlrlreGaMj
— ꪖꪊᦓꪻ꠸ꪀ (@Mustang0x) March 18, 2024
- According to a Q4 2023 report, X/Twitter has a worldwide Attention Metric (AU) of 33.5, placing it in the sixth spot.
- According to the data from our Benchmark Groups (sourced from 239 companies), the median number of Twitter followers for businesses of all types is just north of 1,000.
- As of January 2023, 44% of the marketers use X/Twitter in their digital marketing campaigns.
Sources: Khoros, RivalIQ, eMarketer, Databox, Statista
X (Twitter) Ads Statistics
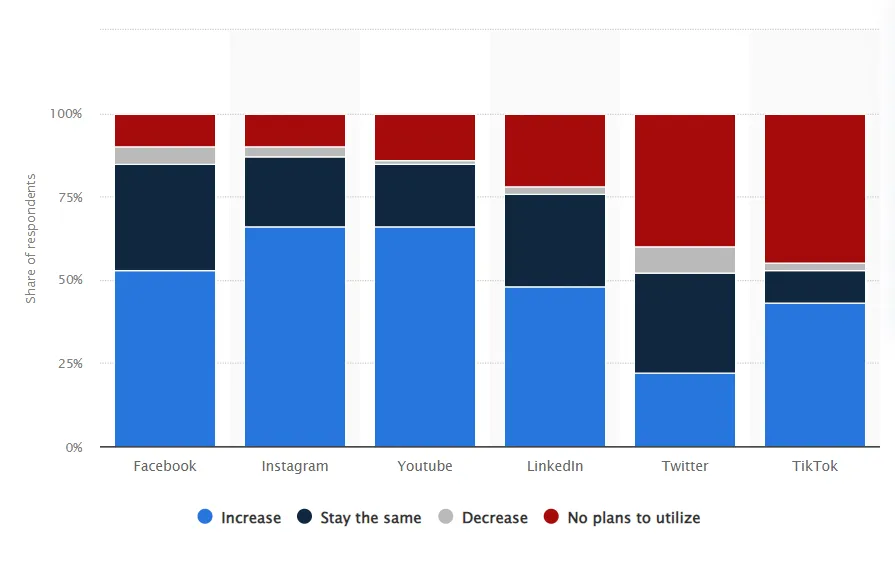
According to a study by Kantar, 26% of marketers plan to cut their ad spend on X (formerly Twitter) in 2025, marking the largest reduction seen across major global ad platforms. Trust in X’s ads has dropped significantly under Elon Musk’s leadership, falling from 22% in 2022 to 12% in 2024.
Additionally, only 4% of marketers view ads on X as offering brand safety, contrasting with Google’s 39% rating for brand safety.
Despite these setbacks, Twitter is actively working to rebuild advertiser trust by introducing enhanced ad placement controls, in-house content moderation, and new advertising incentives.
These measures seem to be making an impact as positive feedback emerges. Twitter can still be a valuable advertising platform for businesses of all sizes.
Still, it’s crucial to stay informed and adapt your X ad strategy based on the latest Twitter stats and evolving features.
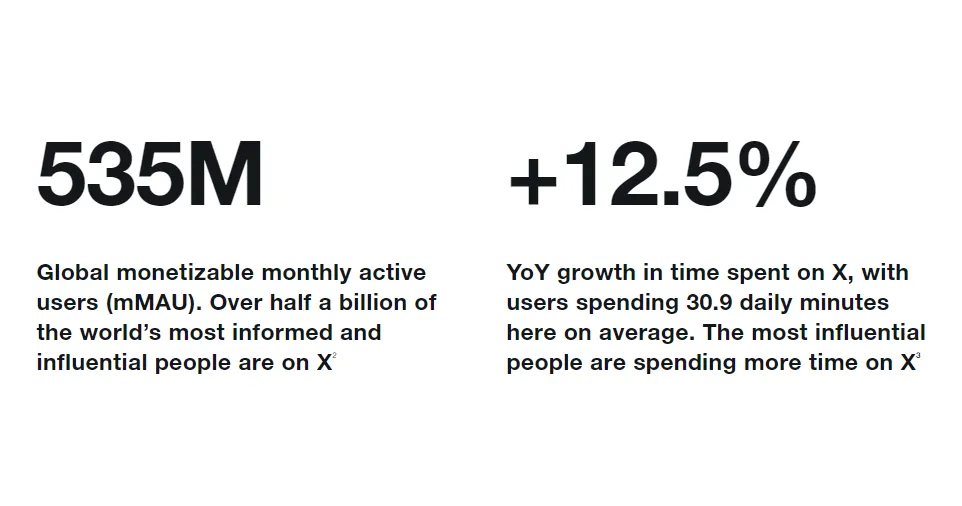
- X/Twitter now has over 535 million global monetizable monthly Active users mMAU.
- The average cost-per-mile CPM of X/Twitter ads in 2024 is $3.11.
- Across industries, X/Twitter ads have an average click-through rate of (CTR) of 0.86%.
- X/Twitter ads have an average cost-per-click (CPC) of $0.58 across all industries, significantly lower than Instagram.
- The value of Twitter in digital advertising revenue worldwide in 2024 is expected to fall to 0.7%.
- There has been a 22% increase in total ad engagements on X/Twitter.
- According to a recently conducted survey, less than 25% of the participants stated that they would increase their marketing activities on X/Twitter.
- X/Twitters users are 7X more likely to engage with a vertical video ad compared to the same ad on the Home timeline.
- Video views are growing at a staggering average rate of 35% YoY.
- The Media sector, with 32.4%, is the highest contributor to Twitter Ads, with a total contribution.
- Recently, X/Twitter paid over 80,000 creators on the platforms through their ad revenues.
- The total male X/Twitter ad reach is 64.3%.
- The total female X/Twitter ad reach is 35.7%.
- Based on an X/Twitter study, the study averaged a return of $2.70 for every dollar spent on Twitter ad campaigns, an average ROI of nearly 40% higher than other media channels.
Sources: Twitter Business, Brafton, Statista, X Ad revenue, X Business, Social media data, eMarketer, Data Reportal, X Marketing
Conclusion
Twitter provides immense possibilities for quickly communicating with your audience. You must schedule engaging tweets at the right time, monitor brand mentions, respond quickly, reach out to influencers, and collaborate with other brands for cross-promotion, analysis, and much more.
With the above X/Twitter statistics, you can get an idea about the current state of Twitter. As the platform is rebuilding itself, you need to keep track of all that is unfolding on Twitter to create an informed strategy.

